
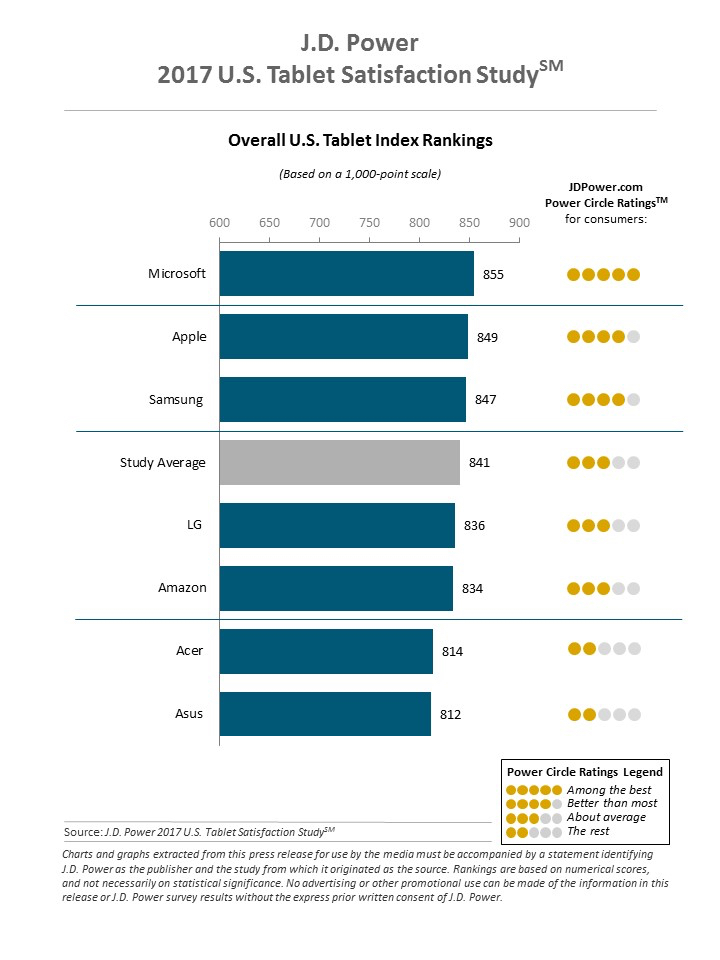
Microsoft ranks highest in overall satisfaction in the J.D. Power 2017 U.S. Tablet Satisfaction Study, doing so for the first time since the study’s inception. With an overall satisfaction score among tablet owners of 855 (on a 1,000-point scale), Microsoft’s achievement is largely due to its top rankings in the features and styling & design factors, according to J.D. Power, a consumer insights, advisory services and data and analytics.
In features, Microsoft is the highest performer in three areas: variety of pre-loaded applications; Internet connectivity; and availability of manufacturer-supported accessories. Microsoft Surface users have the highest incidences of accessory use, which underscores the device’s versatility, according to J.D. Power.
These accessories include a stylus (48% vs. 27% industry average); physical keyboard (51% vs. 14%); and mouse (27% vs. 6%), all of which have higher satisfaction. Microsoft also achieves the highest ratings in these features attributes: variety of input/output connectivity and amount of internal storage available.
Additionally, Microsoft has the highest performance in three styling and design attributes: size of tablet; quality of materials used; and attractiveness of tablet design. Microsoft continues to achieve the highest rating in the remaining styling & design attribute of location of non-display buttons/controls.
According to J.D. Power, customers using Microsoft tablets are more likely to be early adopters of technology. More than half (51%) of Microsoft customers say they “somewhat agree” or “strongly agree” that they are among the first of their friends and colleagues to try new technology products. This is relevant because early adopters tend to have higher overall satisfaction (879 among those who “somewhat agree” or “strongly agree” with this statement vs. 816 among those who don’t).
Microsoft also has a higher proportion of younger customers than their competitors. Microsoft customers are notably more likely to consider productivity features as important. For example, when customers are asked the importance of their tablet to perform certain jobs well, Microsoft owners have the highest incidence of saying “very important” for jobs related to productivity.
These include browsing the internet (90% vs. 75% industry average); emailing (76% vs. 61%); word processing (63% vs. 30%); and mobile payments/banking (53% vs. 40%). Following are some of the other key findings of the 2017 study:
- Overall customer satisfaction with tablet devices is 841, an increase of 21 index points from the 2016 U.S. Tablet Satisfaction Study—Volume 2, released six months ago.
- Lower price and past experience are the most commonly cited reasons for tablet selection among customers (22% each). Reputation is next at 19%.
- The average screen diagonal among Microsoft customers is highest, at 11.8 inches. Satisfaction is 869 among customers whose screen diagonal is 10 inches or more vs. 850 among those whose screen diagonal is 8-10 inches and 824 among those whose screen diagonal is less than 8 inches.
- Nearly one-third (32%) of customers have a data plan with their tablet. Overall satisfaction among customers with a data plan is 863 vs. 834 among those without such a plan.
The U.S. Tablet Satisfaction Study, now in its sixth year, measures customer satisfaction with tablets across five factors (in order of importance): performance (28%); ease of operation (22%); features (22%); styling and design (17%); and cost (11%). The 2017 study is based on experiences evaluated by 2,238 tablet owners who have owned their current device for less than one year. The study was fielded between October and December 2016.


