
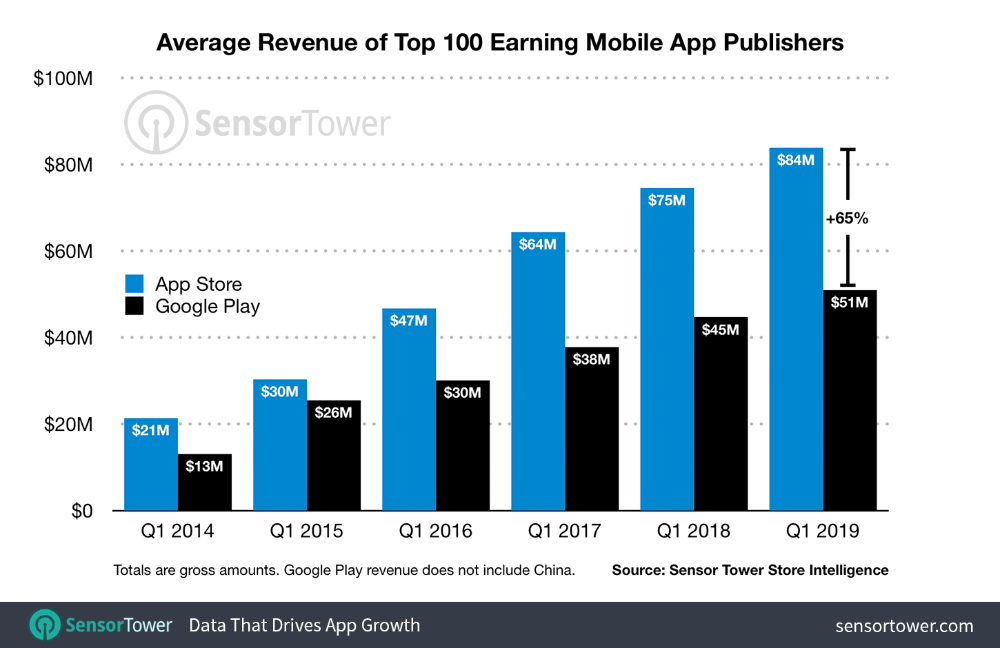
The top 100 earning app publishers across Apple’s App Store and Google Play generated a combined average of $130.4 million in consumer spending globally during the first quarter of 2019, Sensor Tower Store Intelligence estimates reveal. The App Store’s top publishers saw average gross income of $83.8 million, which was 64% more than the average of $51 million spent across Google Play’s 100 highest-earning app makers.
The research group analyzed quarterly consumer spending in apps from the top 100 publishers on the App Store and Google Play between quarter one (Q1) of 2014 and 2019. Sensor Tower’s analysis revealed a compound annual growth rate (CAGR) of about 31 percent over this period, with the App Store and Google Play’s individual CAGR at a closely matched 31.3% and 31.2%, respectively.
The average consumer spend per top 100 publisher globally last quarter across both stores was 12.1 percent greater than in Q1 2018, when an estimated $116 million was spent. Last quarter’s $130.4 million average was 285% more than the average of $33.9 million spent by consumers across these publishers in Q1 2014. The App Store’s average has grown 291% since then, while Google Play’s has increased 289 percent.
Looking specifically at the 100 highest-earning publishers of non-gaming apps, Sensor Tower found that the difference in average consumer spending between the App Store and Google Play is far greater. Consumers spent an average of $23.3 million in apps from the App Store’s top non-gaming publishers last quarter, compared to $7 million on Google Play.
This represented a 232% difference, with the top non-gaming publishers on Apple’s platform earning 3.3 times as much as their Google Play counterparts on average. The combined top 100 earning non-gaming publishers across both stores grossed an average of $29 million during Q1.
The average gross revenue for the top 100 non-gaming publishers across both stores has increased at a CAGR of 56% since Q1 2014, with the App Store and Google Play having individual CAGRs of 56.1% and 50.9%, respectively, according to Sensor Tower. Consumers spent about 33% more on average across the top 100 earning non-gaming publishers last quarter than in Q1 2018, with the average spent in apps from the App Store’s top publishers growing 30.5% year-over-year and Google Play’s up 44.4% versus the year-ago quarter.
Sensor Tower also analyzed the top 100 games publishers overall and on each store, finding that the difference in average spending between the App Store and Google Play was closest here—but still greatly in favor of Apple. An average of $114.5 million was spent between the combined top games publishers on both stores last quarter, nearly four times more than the $29 million average revenue of the top non-gaming publishers. The topmost App Store games publishers by revenue last quarter grossed an average of $70.3 million, 48% more than the $48 million seen on Google Play.
The average revenue of the top 100 games publishers across both stores has grown at a CAGR of 28.5% since Q1 2014, with Google Play growing slightly faster than the App Store at 30.2% CAGR compared to 27.9%, according to Sensor Tower. The average top 100 games publisher on Google Play made 12.6% more in Q1 compared to the year-ago quarter, versus 9.8% quarter-over-quarter growth seen on the App Store.
Sensor Tower says Apple’s App Store remains the leading mobile storefront in terms of consumer spending from a variety of perspectives. Last year, consumers spent 88% more on the App Store than on Google Play, according to Sensor Tower’s overview of 2018 app spending.


