
Overall satisfaction with paid streaming video service is highest among cord stackers—customers who subscribe to a traditional cable/satellite service in addition to streaming video service—according to the J.D. Power 2016 Streaming Video Satisfaction Study.
The inaugural study measures overall satisfaction among customers who have used a subscription- or transaction-based streaming video service within the past six months. The study measures customer satisfaction by examining six key measures (listed in order of importance): performance and reliability; content; cost of service; ease of use; communication; and customer service. Scores for each measure are reflected in an index based on a 1,000-point scale.
The study finds that although the number of customers who cut the cord on pay TV is growing, the majority of streaming video customers still purchase a paid TV service in addition to a streaming video service. Three-fifths (60%) of streaming customers are cord stackers; 23% are cord shavers (those who still subscribe to TV but have downgraded their service package); 13% are cord cutters (those who have recently canceled TV service); and 4% are cord nevers (those who have never subscribed to pay TV and only subscribe to streaming video service).
Overall satisfaction is lowest among cord cutters (802), followed closely by cord nevers (807), while satisfaction is highest among cord stackers (826) and cord shavers (822). Satisfaction in all measures is lower among customers who do not have cable/satellite TV than among those who do, with an especially wide gap between the two segments in the content measure (40 points).
Nearly two-thirds (62%) of customers use a streaming service to binge watch—the act of watching multiple episodes in succession—TV programming. Overall satisfaction is 35 points higher among those who binge watch vs. those who do not (834 vs. 799, respectively). As binge-watching sessions increase in duration, so does overall satisfaction: 823 among those whose most recent session lasted less than four hours; 841 among those whose session lasted 4-8 hours; and 858 among those whose session lasted eight or more hours.
Nearly two-thirds (65%) of customers view streaming content through their TV; 55% view content on a laptop/desktop computer; and 48% view content on a mobile device. More than half (56%) of viewers use multiple devices to watch streaming video.
More than half (54%) of cord nevers and 49% of cord cutters view original content vs. 43% of cord shavers and 41% of cord stackers.
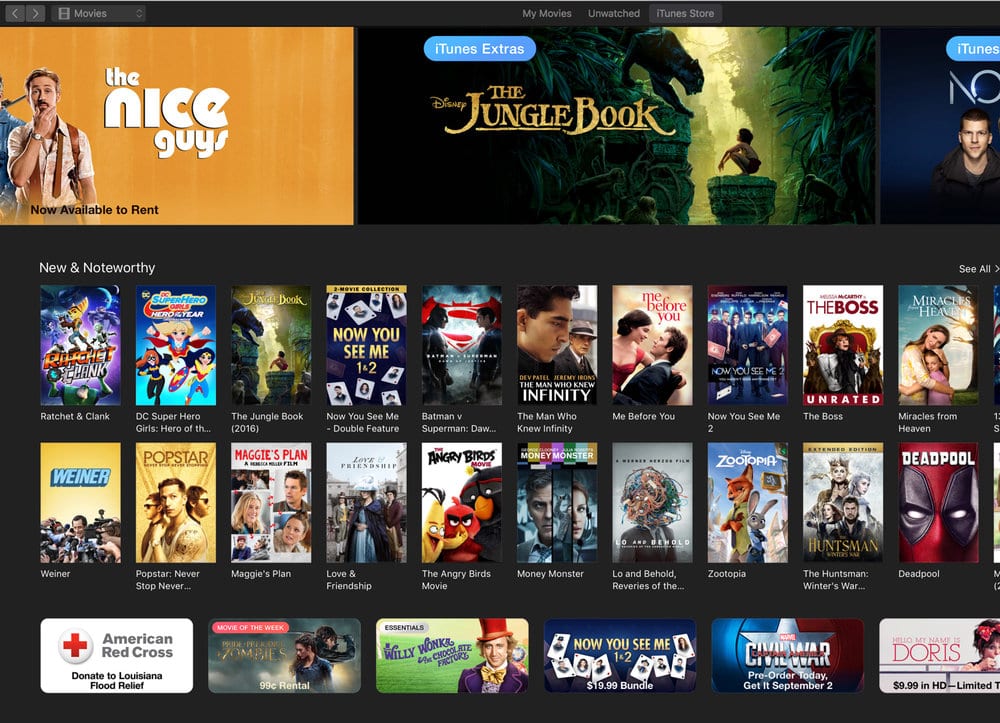
Netflix ranks highest among the streaming video brands included in the study, with an overall score of 829 (out of 1000). Netflix leads or ties with the highest score in five of the six measures, performing particularly well in performance and reliability and in customer service. Hulu Plus follows closely at 821, which is one point above industry average. Cost of service and communication are strong measures of performance for Hulu Plus. VUDU scored 810, iTunes scored 807, and Amazon Prime 806.
A J.D. Power rep told AppleInsider that iTunes did poorly mostly because of complaints about cost and customer service. iTunes only supports purchases and rentals — while Netflix and Hulu don’t offer downloads, subscribers to them can watch anything they have available for less than $10 per month.
The 2016 Streaming Video Satisfaction Study is based on responses from 3,928 customers. The study was fielded in June-July 2016.