
Customer satisfaction is much higher among smartphone owners currently subscribing to full-service wireless carriers, compared with those purchasing service through a non-contract carrier, according to the “J.D. Power 2016 Full-Service Smartphone Satisfaction Study—Volume 2” (http://www.jdpower.com/resource/us-wireless-smartphone-satisfaction-study) and the “J.D. Power 2016 Non-Contract Smartphone Satisfaction Study.” Not surprisingly, Apple and Samsung lead smartphone rankings in the full service and non-contract segments.
These studies measure customer satisfaction with smartphone brands among subscribers of Tier 1 wireless carriers, AT&T, Sprint, T-Mobile and Verizon Wireless. Also measured is satisfaction with smartphones among subscribers to non-contract carriers as a group, such as MetroPCS, Cricket, Virgin Mobile or Boost Mobile. Overall satisfaction among wireless subscribers in the full-service carrier segment is 8.30 (on a 10-point scale), compared with 7.86 among subscribers who purchase wireless service from such non-contract carriers.
One of the reasons for higher smartphone satisfaction in the full-service segment is the higher incidence of customers with the latest smartphones, compared with the non-contract segment, according to J.D. Power. The full-service smartphone study shows that the latest devices typically generate much higher satisfaction ratings than older models because the most current technology and performance features are included in the newer models.
For example, full-service customers give their smartphone a rating of 8.54 in camera picture and video quality, while non-contract customers rate their smartphone 7.74 in this attribute. Similarly, full-service customers give their smartphone a rating of 8.35 in processing speed of operating system vs. a rating of 7.64 provided by non-contract customers.
“Typically, full-service carriers will offer the latest smartphones before the non-contract brands mainly due to the higher price points of newer devices,” says Kirk Parsons, senior director and technology, media & telecom practice leader at J.D. Power. “The majority of the wireless service expense is tied to the device, and the purchase price can be as high as $750. Price points can influence both model selection and a customer’s experience with the device. When customers are satisfied with their smartphone selection, the manufacturer and carrier can benefit through customer loyalty and repurchase intent.”
Notably, there is a considerable difference between the two segments in the average price paid for a device. On average, full-service customers pay $361 for their phone vs. $137 paid by non-contract customers. More than half (51%) of non-contract customers cite “price/cost” as the main reason for choosing a particular brand of smartphone, while the most common reason cited by full-service customers is “phone features” at 31%.
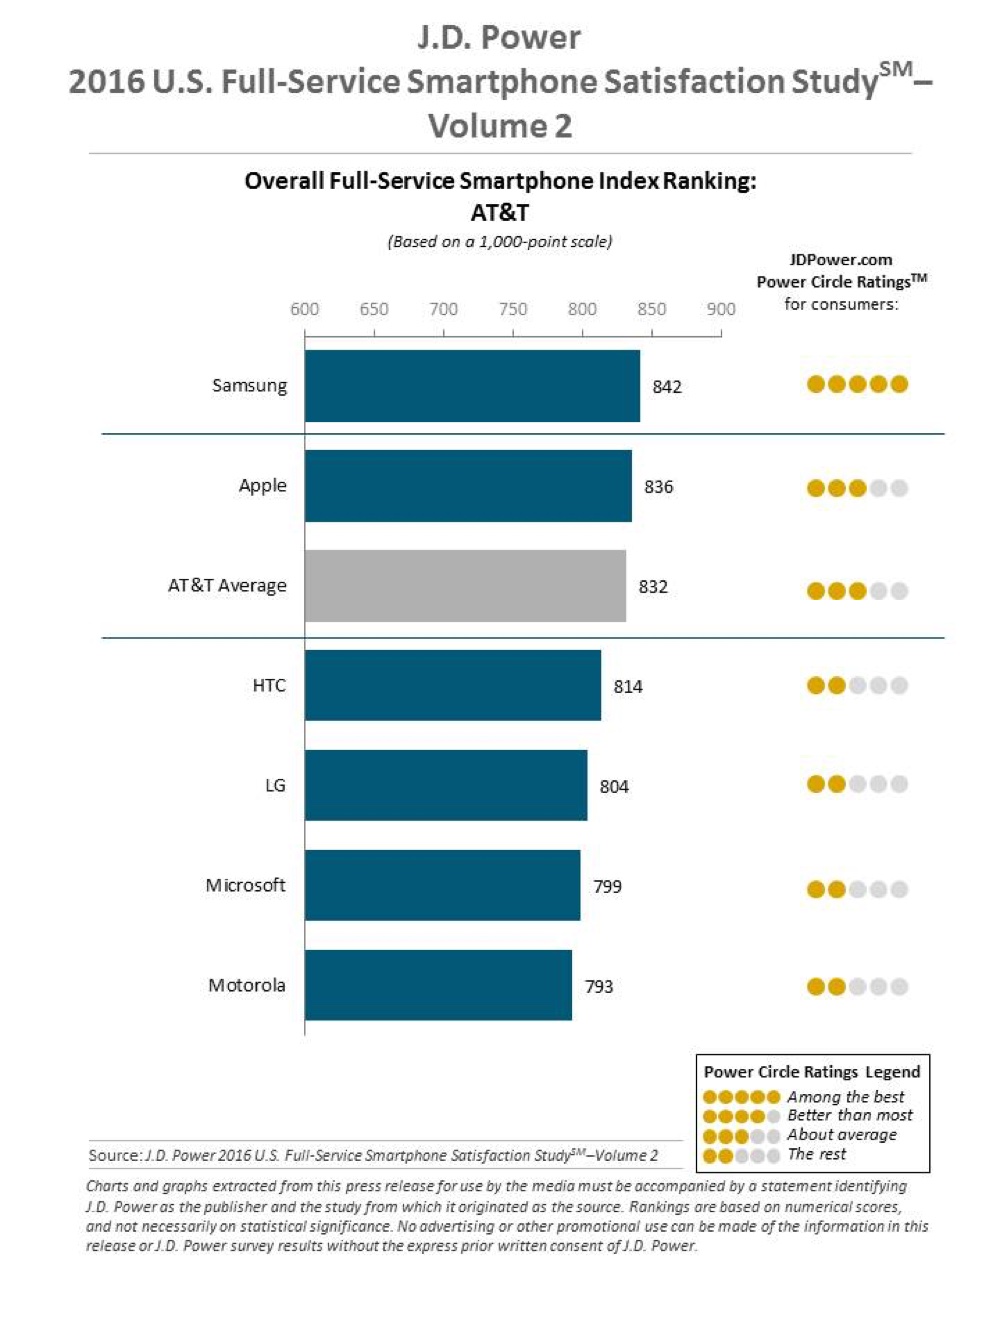
Apple ranks highest in overall satisfaction among T-Mobile (843) and Verizon Wireless (834) wireless customers, while Samsung ranks highest among AT&T (842) and Sprint (834) customers.
Apple ranks highest overall among non-contract brands, with a score of 811. Other brands that rank above segment average are Microsoft (796), Samsung (790) and LG (782).
Following are some of the key findings of the 2016 studies:
- Carrier-level satisfaction differs: Among carriers, overall satisfaction with smartphones is highest among AT&T customers (832), followed by Verizon Wireless (825), Sprint (824) and T-Mobile (821) customers.
- Smartphone loyalty is stronger for full service carriers: More than one-third (35%) of full-service customers say they “definitely will” repurchase a phone made by their current manufacturer vs. 20% of non-contract customers who say the same.
- Customer interest in wireless charging is high: In both the full-service and non-contract segments, the highest percentages of customers cite “wireless charging” when asked to select the top three features they would like on their next smartphone (51% and 49%, respectively).
- Shifting away from subsidized phones: The shift away from phone subsidies in the full-service segment contributes to the rise in the average smartphone price to $361 from $318 in 2016 Volume 1 and $239 in 2015 Volume 1.
Now in its 10th year, the “Full-Service Smartphone Satisfaction Study” measures customer satisfaction based on five factors (in order of importance): performance (25%); ease of operation (21%); battery (20%); physical design (19%); and features (16%). Volume 2 of the study is based on experiences evaluated by 12,248 smartphone customers who have owned their current smartphone for less than one year and who are customers of one of the four Tier 1 carriers. The study was fielded between March and August 2016.
The inaugural “Non-Contract Smartphone Satisfaction Study” measures customer satisfaction based on six factors (in order of importance): performance (24%); physical design (18%); ease of operation (17%); features (16%); battery (13%); and cost (13%). The study is based on experiences evaluated by 2,762 smartphone customers who have owned their current smartphone for less than one year and who are customers of non-contract providers. The study was fielded between September 2015 and August 2016.


