HYLA Mobile, a provider of software technology and services for mobile device trade-in and reuse solutions, says mobile device trade-in programs successfully returned more than $2.26 billion to U.S. consumers in 2018.
With trade-in programs delivering an additional $110 million to consumers than in 2017, HYLA’s data reveals the growing popularity of trade-in programs, with consumers, carriers, retailers and manufacturers all realizing the latent value in devices. Key findings from the report reveal that:
-
Consumers holding onto their devices is a trend that continues; the average age of a smartphone at trade-in in 2018 was 2.77 years, a rise from 2.59 years in 2017 and 2.38 years in 2016
-
The average value of an iPhone at trade-in in 2018 was $157.57, while an Android was $62.05. The average value of an iPhone at trade-in has increased from $149.11 in 2017 and $142.55 in 2016.
-
The Galaxy S7 was the top traded Samsung device in every quarter of 2018.
-
For the third year in a row, the iPhone 6 was the top traded device. Out of the five top traded devices, it made up 30.52% of device trade-ins.
-
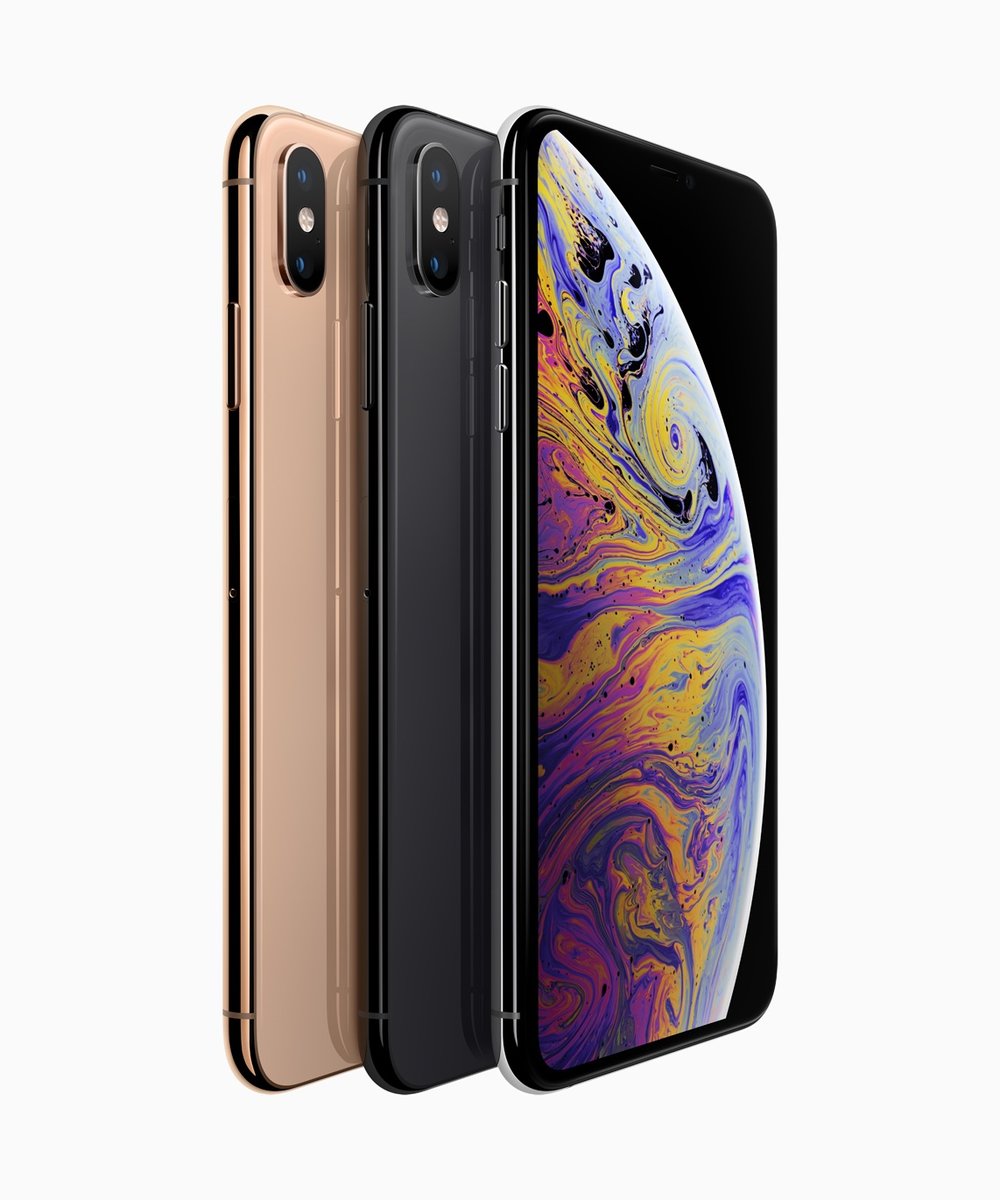
The device with the highest trade-in value in 2018 was the iPhone Xs Max at $586.58.

While the market is seeing prices of new devices rising, models are also losing their value quickly. The iPhone Xx Max, for example, had the highest trade-in value in 2018 at $586.58, while at the same time the smartphone had lost 59.52% of its retail value since its launch in September. The Google Pixel 2 was released in 2017 and lost half of its trade-in value in 2018. The iPhone 8 on the other hand, which was released in the same year, only lost 28% of its value in 2018.
“This is all the more reason for consumers to trade-in their devices at the time of upgrade, rather than hang on to a depreciating model,” says Biju Nair, president and CEO of HYLA Mobile. “The retail price of new high-end devices is not decreasing, so obtaining a higher trade-in value helps subsidize the price of the new purchase. Trade-ins have proven to be the best antidote for a slowing device sales cycle.”
The company’s Trade-In Industry Trends 2018 Annual Summary combines live market data with data from its own analytics solutions, which helps carriers and manufacturers determine trade-in values to be offered to consumers, as well as the disposition prices for these devices in the secondary market.
