
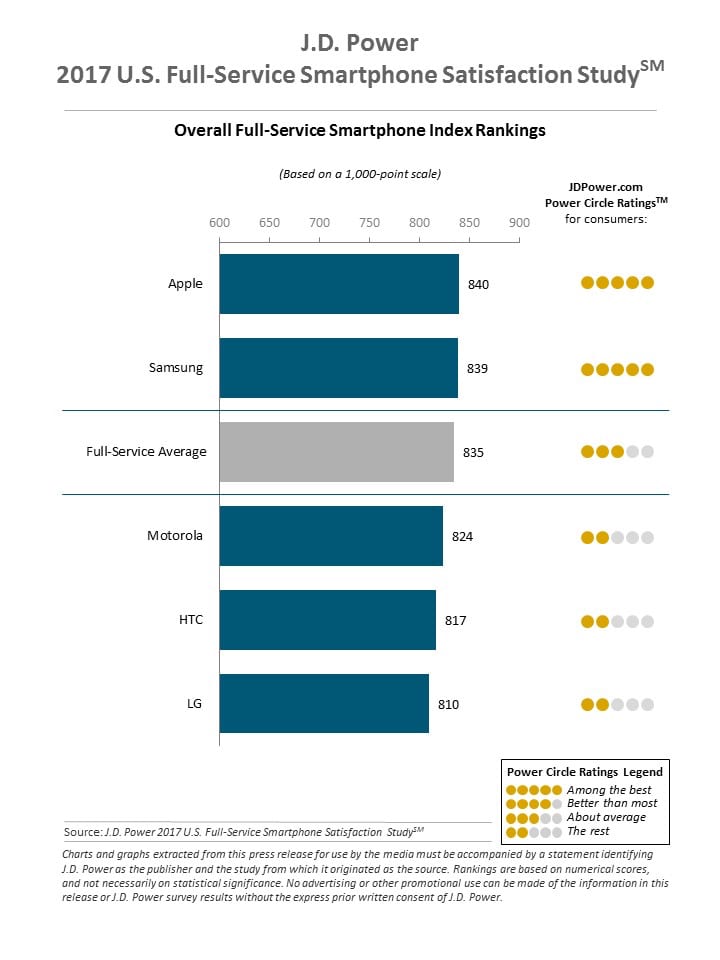
Apple ranks highest in overall satisfaction in the smartphone full-service carrier segment with a score of 840 (out of 1000), followed closely by Samsung (839). Apple ranks highest overall in performance and features dimensions, according to the J.D. Power 2017 Full-Service Smartphone Satisfaction Study, which was released today. Customer satisfaction is much higher among smartphone owners who use their device to operate other connected home services such as smart thermostats and smart appliances, notes the research group.
Overall satisfaction with smartphones is 49 points higher among customers with voice-activated home assistants such as Amazon Echo (881 vs. 832 on a 1,000-point scale) than those without such a device. Significant gaps also are seen among customers with a smart thermostat than without (865 vs. 831, respectively) and customers with a smart appliance than without (866 vs. 832). Overall satisfaction with smartphones is especially high (885) among owners who have all three of these connected home devices.
In all factors measured in the study, customers with connected home devices have higher satisfaction than those who do not, with the gaps most pronounced in the features factor. Features satisfaction is 74 points higher among those who have voice-activated home assistants than those who do not (861 vs. 787, respectively). Among features attributes, customers who have connected home devices provide notably high ratings for a variety of phone file formats and a variety of additional content available, since connected home devices provide access to additional smartphone functionalities.
“Customers with connected home devices are able to improve the comfort, convenience and security of their living spaces with their smartphone devices,” says Kirk Parsons, senior director and technology, media & telecom practice leader at J.D. Power. “They are more satisfied with their smartphones because they can take advantage of smartphone functionalities that other customers may not be aware of. Smartphone manufacturers that make it easier for their products to connect with other devices will have a major advantage in improving customer satisfaction as homes become smarter and more automated.”
The frequency of smartphone use for connected home devices also affects smartphone satisfaction. Customers using their smartphone daily in such a manner have much higher satisfaction than those who use their smartphone less frequently for smart thermostats (926 vs. 866, respectively); smart appliances (929 vs. 851); and voice-activated home assistants (928 vs. 878).
All ranked brands have seen improvements in overall satisfaction during the past year, with Motorola (824) showing the greatest improvement since the 2016 Vol. 1 study (+15 points), followed by HTC (+12 points) and Apple (+6 points). Most of these gains came since last volume, in which Motorola, HTC and LG improved by 22, 17 and 14 points, respectively.
Among carriers, overall satisfaction with smartphones is highest among AT&T customers (841), followed by Sprint (840), Verizon Wireless (831), U.S. Cellular (829) and T-Mobile (828) customers. Customers whose smartphones have iOS have slightly higher incidences than customers whose smartphones have Android of owning smart thermostats (13% vs. 11%, respectively); smart appliances (9% vs. 8%); and voice-activated home assistants (7% vs. 6%).
Customers who are more satisfied with their smartphone are better brand advocates than those who are less satisfied, according to J.D. Power. Among customers who are delighted (satisfaction score above 900), 73% say they “definitely will” recommend their smartphone brand. That percentage drops to 40% among satisfied customers (satisfaction of 750-900); 13% among indifferent customers (satisfaction of 550-749); and just 7% among dissatisfied customers (satisfaction below 550).
The shift away from phone subsidies in the full-service segment contributes to the rise in the average smartphone price of $366 from $361 in 2016 and $318 in 2016.
Now in its 11th year, the Full-Service Smartphone Satisfaction Study measures customer satisfaction based on five factors (in order of importance): performance (25%); ease of operation (21%); battery (20%); physical design (19%); and features (16%). The study is based on experiences evaluated by 7,994 smartphone customers who have owned their current smartphone for less than one year and who are customers of one of the five Tier 11 wireless carriers. The study was fielded between October and December 2016.